TL;DR Open Dashboards, create a dashboard, switch to Editing, and add Bar chart - storage with Soil notation set to Weight. The widget shows the weight of your pile in t.
Prerequisites
- A storage with a pile that has a Soil and a geofence. A pile without a geofence shows 0. See Creating Storage Places in the Infomap.
- A density on the soil. See SDX-Cloud: Set the density of a material.
Create the dashboard
- Open the project and select Dashboards.
- In Name, enter a name such as the site or the material area.
- Select Create. The dashboard opens with the Viewing and Editing switch.
Expected result - dashboard
A new empty dashboard with your name. If the project already has dashboards, see Create a Dashboard.
Add the tonnage widget
- Select Editing.
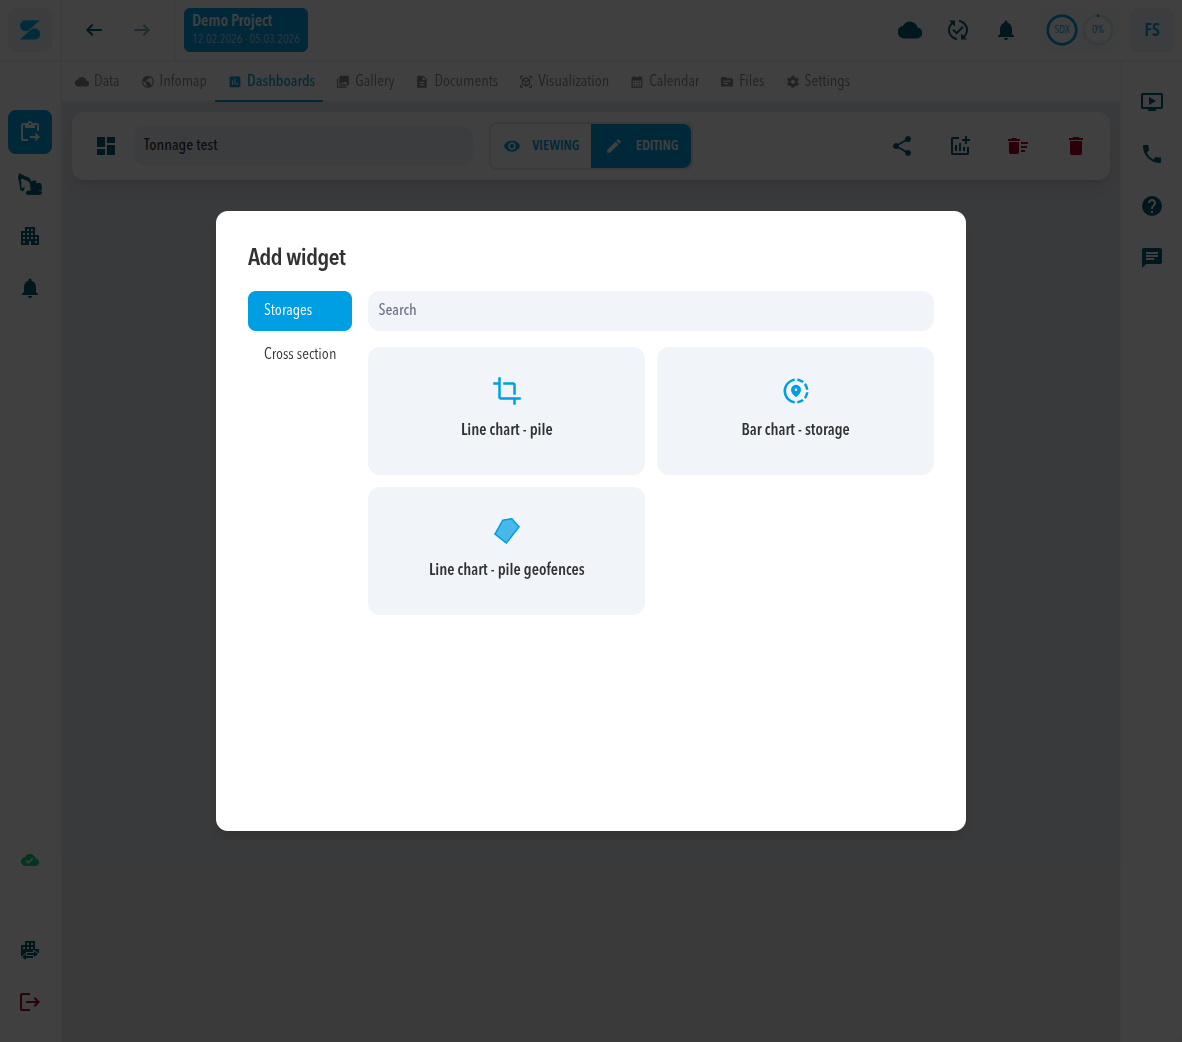
- Select the add chart button. The dialog Add widget opens.
- Under Storages, select Bar chart - storage.
- Enter a Name.
- In Storage, select your storage.
- In Pile, select one pile or All.
- Leave Calculation options on Positive & Negative, or select Positive or Negative.
- In Soil notation, select Weight.
- Check the preview, then select Create.
Expected result - widget
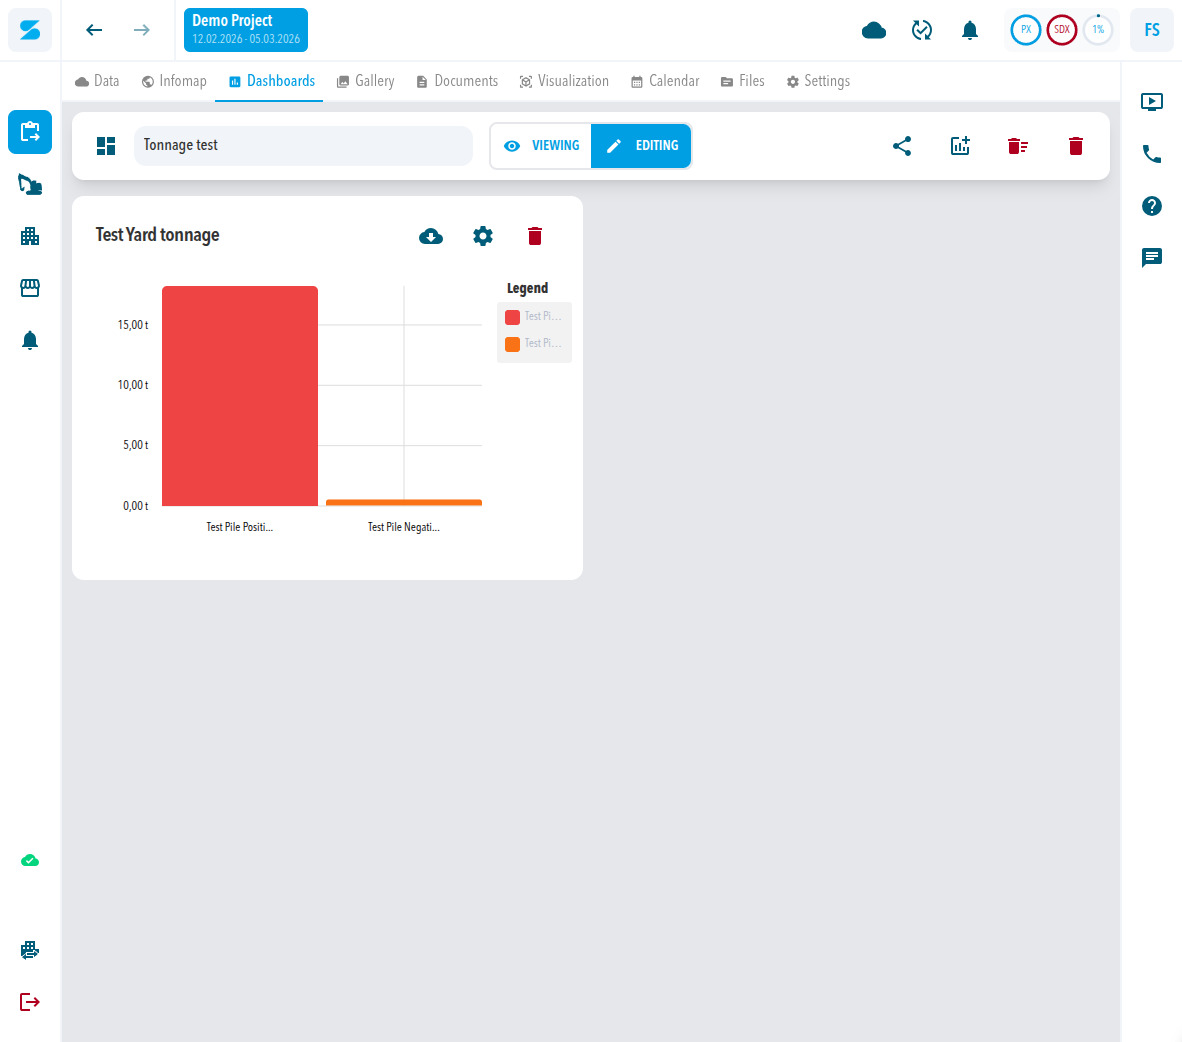
The widget is added to the dashboard. It shows a bar for each pile and a legend with the series, for example Positive and Negative. The axis is in t. Volume shows m³ and Currency shows €. With US survey feet selected in your profile under Settings > Personalization, the axis shows yd³ and tn.
If the weight looks wrong
Check the density on the soil. See SDX-Cloud: Set the density of a material.
Other tonnage widgets
The Storages group also has Line chart - pile and Line chart - pile geofences. See Dashboard - Widget Overview and Dashboard Widget - Storage Places.
Comments
0 comments
Please sign in to leave a comment.